250x250
Notice
Recent Posts
Recent Comments
Link
| 일 | 월 | 화 | 수 | 목 | 금 | 토 |
|---|---|---|---|---|---|---|
| 1 | 2 | 3 | 4 | 5 | 6 | |
| 7 | 8 | 9 | 10 | 11 | 12 | 13 |
| 14 | 15 | 16 | 17 | 18 | 19 | 20 |
| 21 | 22 | 23 | 24 | 25 | 26 | 27 |
| 28 | 29 | 30 | 31 |
Tags
- oracle
- psycopg2
- GPU
- 연결
- Python
- 복구
- docker
- Memory
- 머신러닝
- Linux
- LOG
- TensorFlow
- 오라클
- 쿼리
- 도커
- 도커이미지
- SQL
- jupyternotebook
- 파이썬
- Docker image
- psql
- pgadmin
- cpu
- Jupyter
- sqldeveloper
- 시계열
- GridSearchCV
- 교차검증
- postgre
- 리눅스
Archives
- Today
- Total
areum
[시계열 분석] Prophet을 이용한 기온 예측 본문
728x90
Prophet에 대한 간단한 설명
- 페이스북이 만든 시계열 예측 라이브러리입니다.
- Prophet 모델의 주요 구성요소는 Trend, Seasonality, Holiday입니다.
- y(t)=g(t)+s(t)+h(t)+ϵi (g=Trend, s=Seasonality, h=Holiday )
월 별로 평균기온을 분석하여 예측하기
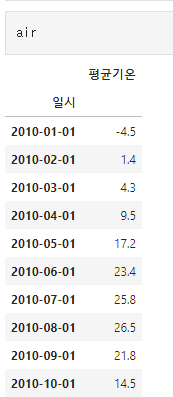
1. Prophet library 및 데이터를 불러온다.
from fbprophet import Prophet
import matplotlib.pyplot as plt      #시각화를 위한 설치
import matplotlib.font_manager as fm    # 한글 폰트
import matplotlib                   #시각화를 위한 설치
import os, warnings
import pandas as pd                #구조 변경 및 결합을 하기 위한 설치
import seaborn as sns              #시각화를 위한 설치
import plotly.express as px        #시각화를 위한 설치

air= pd.read_csv('air.csv',encoding='ANSI')
air_2020= pd.read_csv('air_2020.csv',encoding='ANSI') #예측을 확인해볼 미래 데이터


2. 컬럼 변수들의 이름을 변경한다.
facebook prophet은 날짜를 ds로 해야하고 독립변수를 y라고 설정해야 합니다.
air.columns=['ds','y'] # train
air_2020.columns=['ds','y'] # 예측 결과 확인할 test세트
3. Prophet 모델 적용하기
파라미터에 대한 자세한 설명을 원하시다면 아래 블로그를 통해 확인해주세요 !
저는 파라미터를 아래와 같이 설정해주었습니다.
prophet = Prophet(seasonality_mode = 'addtive',
                 yearly_seasonality=True,
                 weekly_seasonality=True,
                 daily_seasonality=True,
                 changepoint_prior_scale=0.5)
prophet.fit(air)
4. 기간 설정 후 기온 예측하기
12개월 예측을 위해 periods=12로 설정, freq='m'은 month로 한달 주기라는 뜻입니다.
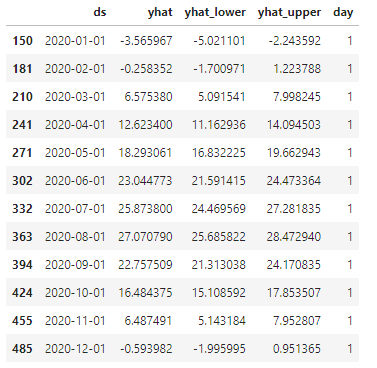
2010년부터 2019년도까지의 데이터를 가지고 2020년도의 월별 평균 기온을 예측해보았습니다.
당시 2020년도의 월별
future_data = prophet.make_future_dataframe(periods = 12, freq = 'm')
forecast_data = prophet.predict(future_data)
a=forecast_data[['ds','yhat', 'yhat_lower', 'yhat_upper']].tail(12)
a.reset_index(drop=True)
pred_y=a.yhat.values[0:11]
test_y=air_2020.y.values[0:11]
pred_y #2020년도의 에측값
test_y #2020년도의 실제값
plt.plot(pred_y,color='red') #예측값
plt.plot(test_y,color='blue') #실제값
5. 예측 성능 평가하기
from sklearn.metrics import mean_squared_error,r2_score
from math import sqrt
rmse=sqrt(mean_squared_error(pred_y,test_y))
print(rmse)38.3456467545'Programming > Machine Learning' 카테고리의 다른 글
| [시계열 분석] Prophet 파라미터 정리 (0) | 2023.03.23 |
|---|---|
| [ML] 로지스틱 회귀 개념 정리 (0) | 2023.03.23 |
| [ML] LogisticRegression(로지스틱 회귀) (0) | 2023.03.21 |
| [ML] K-Means Clustering (K-평균 군집) (0) | 2023.03.17 |
| [ML] Association Rule Analysis (연관 규칙 분석) (0) | 2023.03.14 |


